只涉及概念和记号, 不涉及算法.
Directed graphs are useful for expressing causal relationships between random variables, whereas undirected graphs are better suited to expressing soft constraints between random variables. For the purposes of solving inference problems, it is often convenient to convert both directed and undirected graphs into a different representation called a factor graph.
Notation: probability measure
把 $\mathbb P(X \in A)$ 记为 $p(X)$, 因为很多时候不关心 $A$, 只是用后者表示 $X$ 对应的概率测度.
另外记 $p(X) = \sum_Y p(X, Y)$, 这里 $\sum_Y$ 只是积分的简记. 以及 $p(X, Y) = p(Y\vert X) p(X)$.
这套记号虽然失去了一点严谨性, 但是很方便, 也抓住了精髓.
Bayesian networks (directed graphical models)
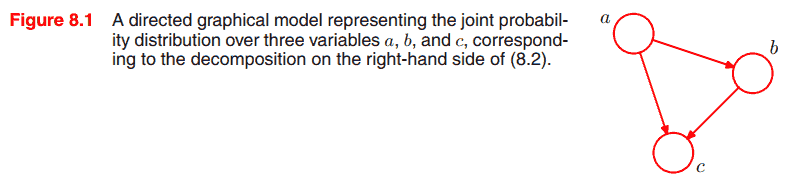
把联合分布分解成若干个因子 (factor) 的乘积
\[p(a, b, c) = p(c|a, b)p(b|a)p(a)\]表示为
Notation. Each node represents a random variable (or group of random variables), and the links express probabilistic relationships between these variables.
这个有向图的表示依赖于分解的顺序, 而一个联合分布可以有多个分解顺序, 从而对应多个有向无环图.
如图 $a$ 称为 $b$ 的父结点 (parent node). 根据图可以轻松地还原分解顺序. 更一般地,
\[p(x_1, \dots, x_K) = \prod_{k=1}^K p(x_k | \text{pa}_k),\]其中 $\text{pa}_k$ 表示 $x_k$ 的全体父节点.
Notation for multiple nodes
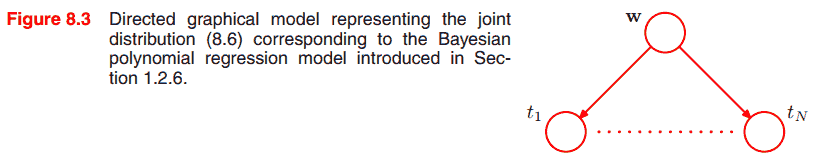
上图中 $t_1, \dots, t_N$ 地位等价, 用新记号表示它们.
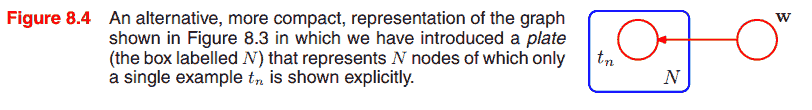
Notation. 画出代表元 $t_n$, 用一个 box 把它圈起来, 称为一个 plate, 然后标记上 $N$ 表示有这么多个同类型的结点.
也可以把模型参数 (确定的值) 和观测值表示上去.
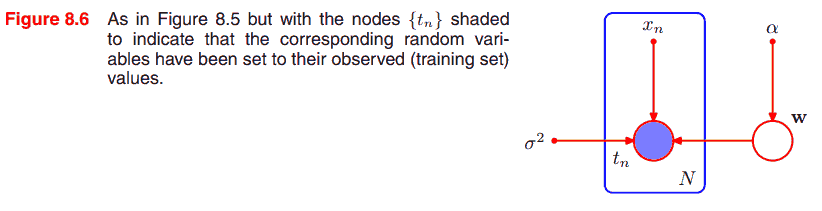
Notation. 用实心小圈表示确定值, 用空心大圈表示随机变量. (随机变量的) 观测值则用带阴影的圈表示 (如图 $t_n$).
如图 $w$ 未被观测, 称为隐变量 (latent variable, or hidden variable).
Conditional independence
有向图模型的一个好处是, 可以直接从图中读出条件独立与否.
Tail-to-tail
由于
\[p(a, b) = \sum_c p(a|c)p(b|c)p(c),\]知 $a$ 和 $b$ 一般不独立.
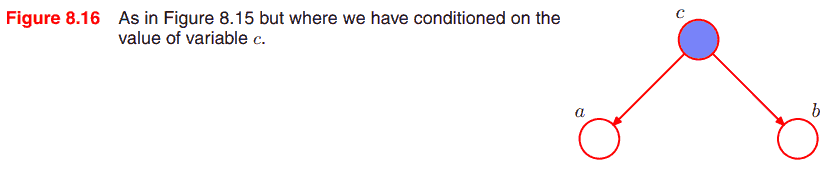
但如果观测到 (given) $c$, 则条件独立, 因为
\[p(a, b | c) = p(a|c)p(b|c).\]The node $c$ is said to be tail-to-tail with respect to this path, and the presence of such a path connecting nodes a and b causes these nodes to be dependent. However, when we condition on node $c$, as in Figure 8.16, the conditioned node ‘blocks’ the path from $a$ to $b$ and causes $a$ and $b$ to become (conditionally) independent.
Head-to-tail

可知 $a$ 和 $b$ 不独立, 但
\[p(a, b | c) = p(b|c)p(a|c),\]故 given $c$ 后条件独立.
Head-to-head
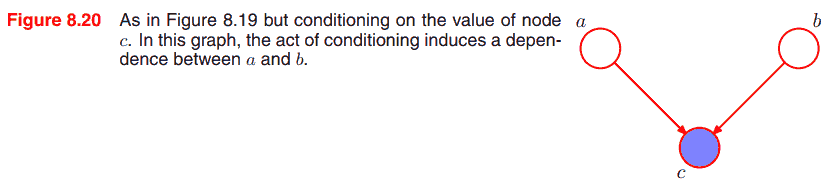
这个比较特殊, $a$ 和 $b$ 独立, 但是 given $c$ 之后就不是条件独立.
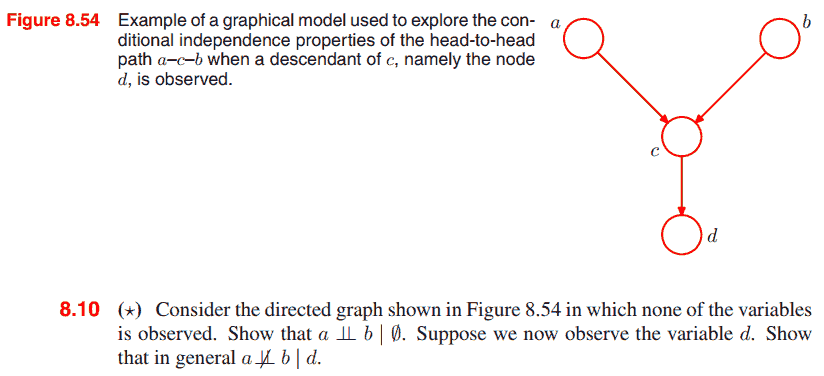
We say that node $y$ is a descendant of node $x$ if there is a path from $x$ to $y$ in which each step of the path follows the directions of the arrows. Then it can be shown (Exercise 8.10, 显然) that a head-to-head path will become unblocked if either the node, or any of its descendants, is observed.
D-separation
其中 D 表示 directed. Consider a general directed graph in which $A$, $B$, and $C$ are arbitrary sets of nodes. We call tell if $A$ and $B$ are conditionally independent given $C$ by reading the DAG. Consider all paths from any node in $A$ to any node in $B$. Any such path is said to be blocked if it includes a node such that either
- the arrows on the path meet either head-to-tail or tail-to-tail at the node, and the node is in the set $C$, or
- the arrows meet head-to-head at the node, and neither the node, nor any of its descendants, is in the set $C$.
If all paths are blocked, then $A$ is said to be d-separated from $B$ by $C$, and the conditional independence holds. 很自然的推广, 证明略了.
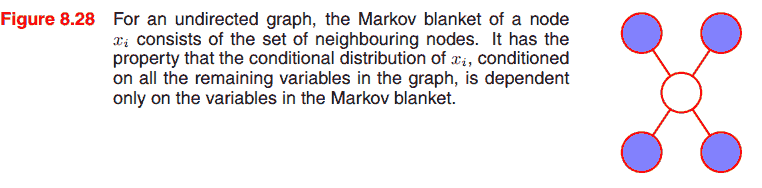
Markov random field (undirected graphical models)
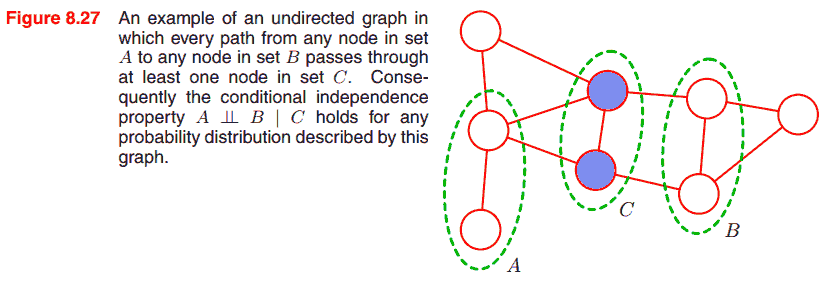
不同于有向图, 无向图模型可以直接从图的分割状况判断条件独立性, 而没有 head-to-head 结点之类的特殊情况.
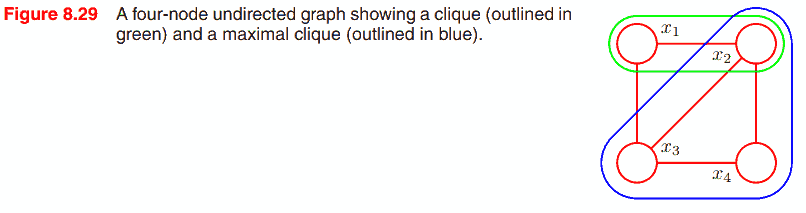
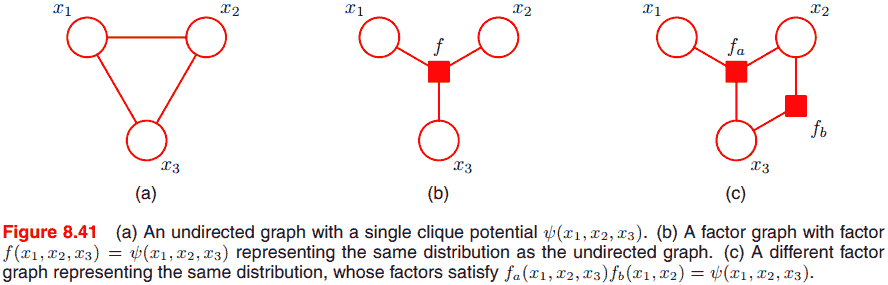
A clique (团) is defined as a subset of the nodes in a graph such that there exists a link between all pairs of nodes in the subset. In other words, the set of nodes in a clique is fully connected.
极大团 (maximal clique) 就是不能加入新结点的团. 下图 $\{x_1, x_2, x_3\}$, $\{x_2, x_3, x_4\}$ 是极大团.
记在团 $C$ 中的全体变量为 $x_C$, 则联合分布可以由势函数 (potential function) $\psi_C(x_C)$ 的在极大团上的乘积表示
\[p(x) = \frac{1}{Z} \prod_C \psi_C(x_C).\]和有向图不同的是, 势函数没有什么限制 (除了一般为非负), 因此需要配分函数归一化. 而配分函数的计算复杂性限制了无向图模型. 在求条件分布时, 配分函数可以约掉, 不会带来限制.
考虑严格正的势函数, 通常写为
\[\psi_C(x_C) = \exp(-E(x_C)),\]其中 $E(x_C)$ 称为能量函数 (energy function), 书中给了 Ising model 的例子.
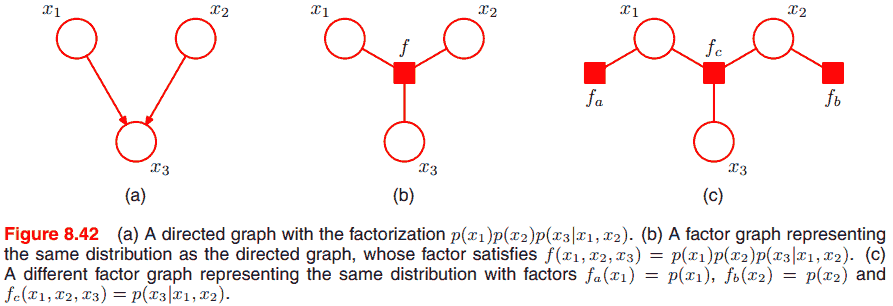
Factor graphs
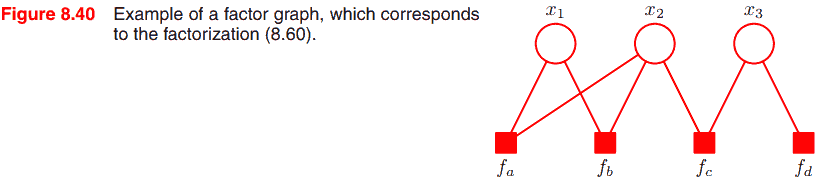
Factor graphs make this decomposition explicit by introducing additional nodes for the factors themselves in addition to the nodes representing the variables. 用处是转化为树的形式, 便于推断.
考虑
\[p(x) = \prod_s f_s(x_s),\]以上图例子来说
\[p(x) = f_a(x_1, x_2) f_b(x_1, x_2) f_c(x_2, x_3) f_d(x_3).\]无向图
有向图
TODO
- 有向图可以转换为无向图 (有什么用?)
- 推断问题比如求某个变量的分布.
- 推断的要点是减少计算复杂度.
- 如果图是树, 那么推断更容易.
- Factor graph